Clamping force is the pressure applied by an injection molding machine to hold the mold closed during the injection and cooling phases. It counteracts the internal cavity pressure generated by molten plastic, ensuring part integrity and preventing defects like flash. Accurate clamping force calculation is vital for product quality, mold longevity, and energy efficiency, especially when partnering with a reliable injection molding company. Properly calculated clamping force ensures optimal mold performance, reducing the risk of defects and extending the lifespan of both molds and equipment.
- 1. What Is Clamping Force?
- 2. Factors Affecting Clamping Force
- 3. Why Is Clamping Force Calculation Important?
- 4. Clamping Force Calculation Methods
- 5. Using Clamping Force Coefficients
- 6. Machine Selection Based on Clamping Force
- 7. Practical Tips for Optimizing Clamping Force
- 8. Common Mistakes and Tips
- Conclusion
1. What Is Clamping Force?
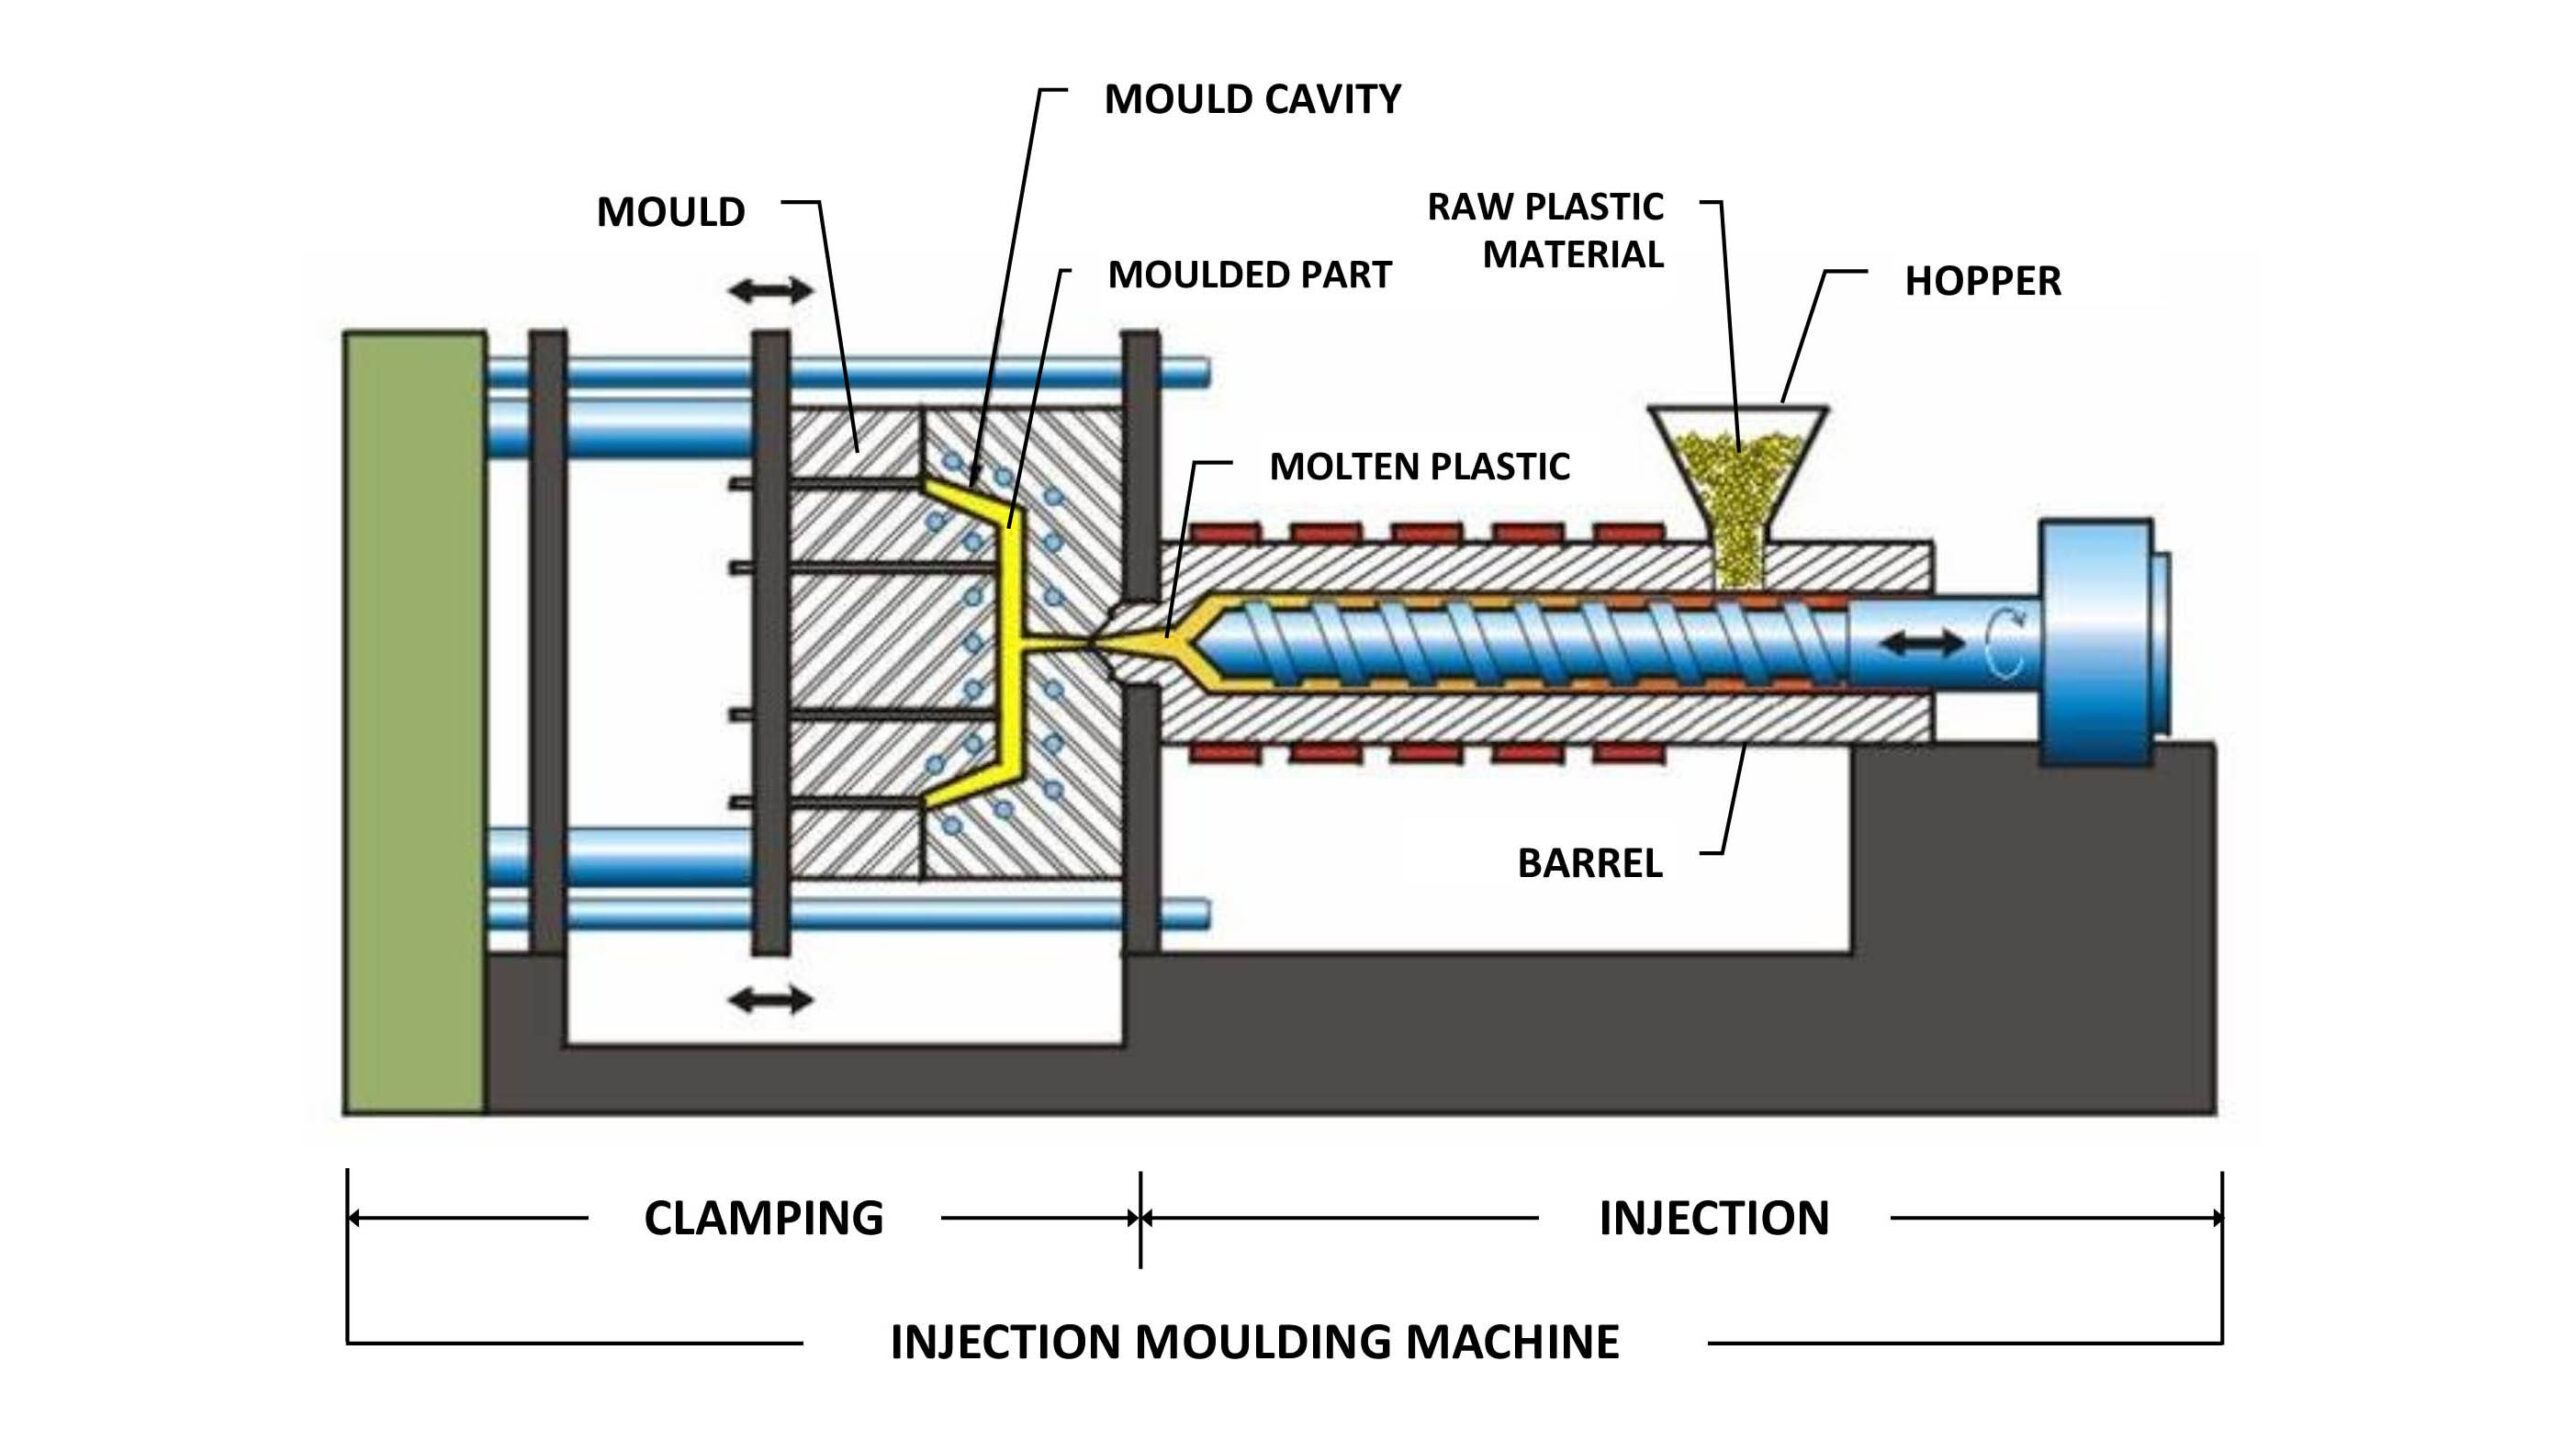
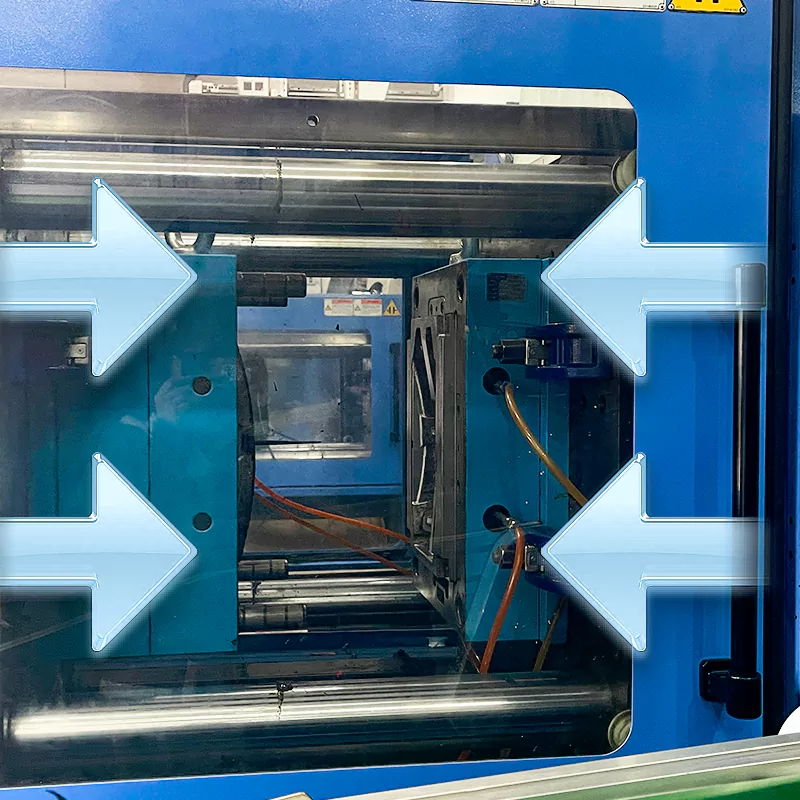
- Definition: Clamping force is the force (measured in tons or kN) exerted by the machine’s clamping unit (hydraulic or electric) to keep mold halves tightly closed during injection. It acts as a “vise grip” to resist the separation force from molten plastic.
- Role of Clamping Units:
- Consists of fixed and movable platens, tie bars, and a toggle/hydraulic mechanism.
- Ensures mold alignment, resists cavity pressure, and enables controlled mold opening/closing.
2. Factors Affecting Clamping Force
Clamping force in injection molding is influenced by four primary factors. Below is a detailed breakdown with quantified relationships, empirical data, and design guidelines supported by industry research and standards.
2.1 Part Geometry and Wall Thickness
- Thin-Walled Parts:
- Thin walls (<1.5 mm) increase flow resistance and cavity pressure. For example, a 0.6 mm wall thickness in GPPS requires a clamping force multiplier of 0.62 tons/cm² due to high cavity pressure.
- Flow length-to-thickness ratio (L/t): Higher ratios (>150:1) demand elevated clamping forces. For instance, a ratio of 200:1 in ABS requires cavity pressures >600 bar.
- Complex Geometries:
- Ribs, undercuts, or multi-cavity molds amplify projected area and pressure. A 50 cm² projected area with complex features may require a 15–20% higher clamping force than simple geometries.
- Data Reference:
| Wall Thickness (mm) | Flow Length (mm) | Material | Clamping Force Multiplier (Kp) |
| 0.6 | 40 | GPPS | 0.62 tons/cm² |
| 2.0 | 100 | ABS | 0.48 tons/cm² |
| 3.0 | 150 | PP | 0.35 tons/cm² |

2.2 Material Properties
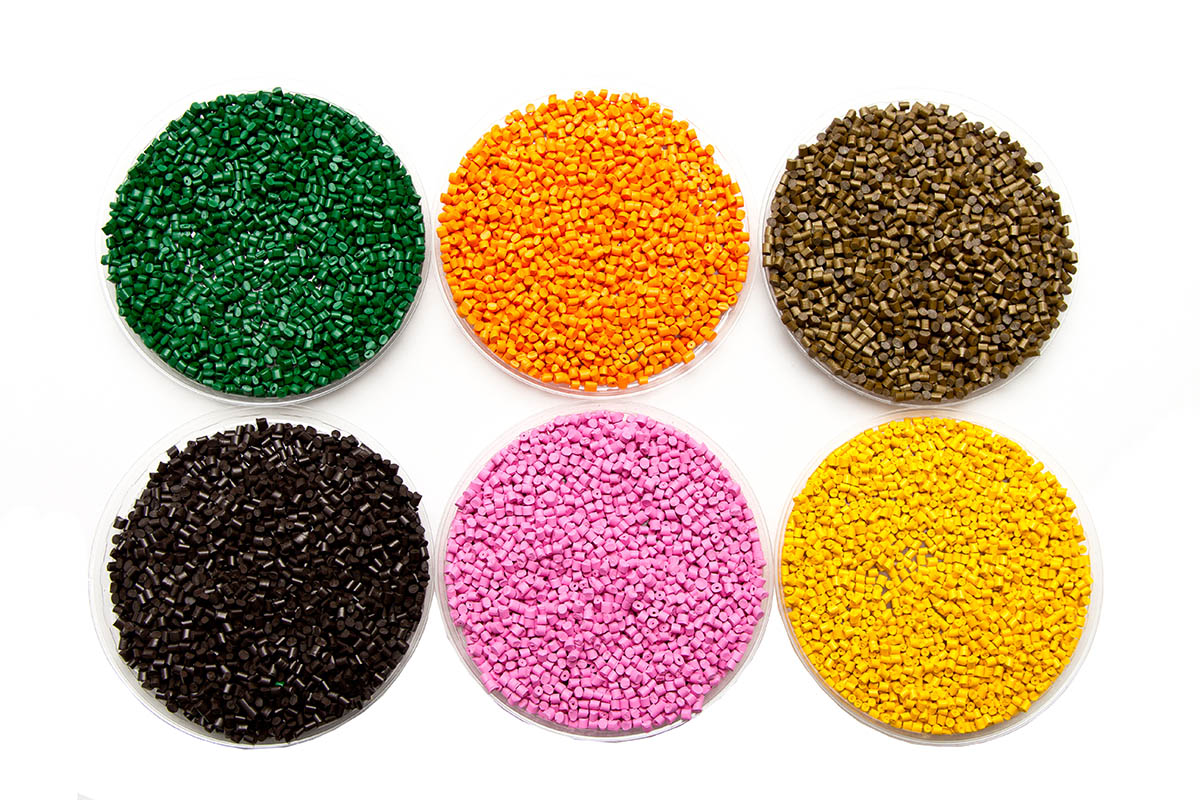
- Viscosity:
- High-viscosity resins (e.g., PC, POM) generate 30–50% higher cavity pressure than low-viscosity materials (e.g., PE, PP) due to shear resistance.
- Example: PC requires a clamp force coefficient Kp=0.62–0.77 tons/cm², while PP uses Kp=0.35–0.45 tons/cm².
- PVT Characteristics:
- Semi-crystalline materials (e.g., PA66) exhibit rapid volumetric changes under pressure, increasing cavity pressure spikes and necessitating higher clamping force margins.
- Material-Specific Data:
| Material | Viscosity (Pa·s) | Clamp Force Coefficient (Kp, tons/cm²) |
| ABS | 200–300 | 0.45–0.60 |
| PC | 400–600 | 0.62–0.77 |
| PP | 100–200 | 0.35–0.45 |
| PE | 50–150 | 0.30–0.40 |
2.3 Mold Design
- Cavities and Runners:
- Multi-cavity molds increase the total projected area. A 4-cavity mold doubles clamping force compared to a single-cavity design .
- Runner length: A 100 mm runner adds ~10–15% to cavity pressure due to frictional losses .
- Gate Design:
- Smaller gates (e.g., 1.5 mm² for ABS) restrict flow, increasing injection pressure by 20–30% and requiring higher clamping force .
- Cooling Channels:
- Poor cooling design causes uneven shrinkage, leading to residual stress and mold deflection. Optimal cooling reduces cycle time but has minimal direct impact on clamping force .
- Design Guidelines:
| Parameter | Impact on Clamping Force |
| Gate size reduction | +20–30% |
| Runner length >150 mm | +15–20% |
| Multi-cavity (4 vs. 1) | +100% |
2.4 Injection Pressure and Mold Temperature
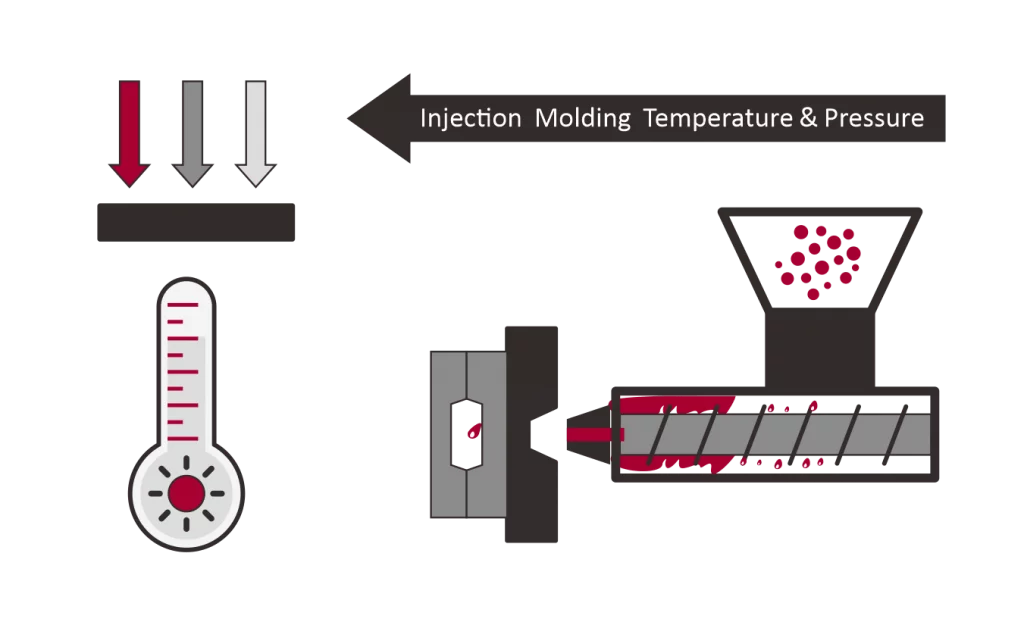
- Injection Pressure:
- Direct relationship:
-
- For example, 800 bar injection pressure requires ~30% higher clamping force than 500 bar.
- High-speed injection (>90% machine capacity) increases shear heating, temporarily reducing viscosity but raising peak cavity pressure.
- Mold Temperature:
- Lower mold temperatures (<40°C for ABS) increase resin viscosity, raising cavity pressure by 10–15%.
- Example: Cooling ABS from 60°C to 40°C increases required clamping force from 120 tons to 138 tons for a 200 cm² part.
- Process Data:
| Injection Speed | Mold Temp (°C) | Material | Clamping Force Adjustment |
| High (90%) | 40 | ABS | +25% |
| Low (50%) | 60 | ABS | Baseline |
| High (90%) | 30 | PC | +35% |
2.5 Conclusion and Data Synthesis
The clamping force is a function of part geometry, material behavior, mold design, and process parameters. Below is a consolidated datasheet for quick reference:
| Factor | Key Variables | Empirical Impact | Typical Range |
| Wall Thickness | L/t ratio, thin walls | +15–50% per 0.5 mm reduction | 0.5–3.0 mm (L/t: 50:1–200:1) |
| Material Viscosity | PC vs. PP | +30–50% for high-viscosity resins | Kp=0.3–0.77 tons/cm² |
| Mold Cavities | 1 vs. 4 cavities | +100% for 4-cavity | 1–8 cavities |
| Injection Pressure | 500 vs. 800 bar | +60% at 800 bar | 300–800 bar |
| Mold Temperature | 40°C vs. 60°C for ABS | +15% at 40°C | 30–80°C (material-dependent) |
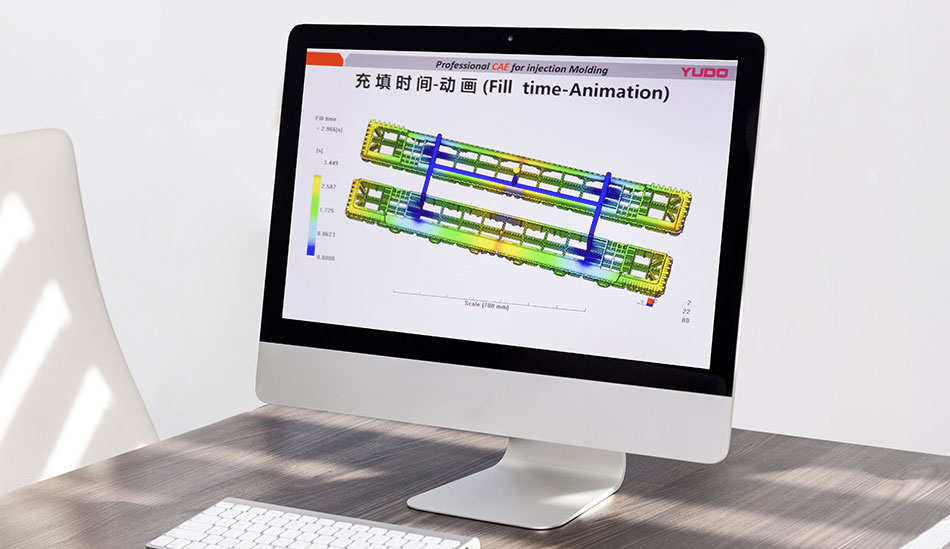
For precision, use simulation tools (e.g., Moldflow) to analyze cavity pressure distribution or adopt empirical coefficients (Kp) during early-stage calculations. Always validate with iterative production tests to eliminate flash and optimize energy use.
3. Why Is Clamping Force Calculation Important?
Clamping force directly impacts part quality, mold longevity, and operational efficiency. Below is a comparison table summarizing the consequences of insufficient vs. excessive clamping force:
| Aspect | Insufficient Clamping Force | Excessive Clamping Force |
| Part Quality | Flash formation (excess material at mold seams), poor symmetry. | No flash, but overpacking causes internal stress or sink marks. |
| Defects | Short shots, dimensional inaccuracies, weak weld lines. | Mold deflection, part sticking, or surface blemishes. |
| Mold & Machine Impact | Mold wear at parting lines due to repeated flashing. | Premature mold damage (cracks, wear on guide pins/platens). |
| Energy Efficiency | Minimal energy waste, but high scrap rates. | Unnecessary energy consumption from machine overloading. |
| Production Costs | Increased scrap, rework, and downtime for mold cleaning. | Higher maintenance costs and risk of machine breakdowns. |
| Cycle Time | Longer cycles to compensate for defects (e.g., flash removal). | No improvement in cycle time; potential delays from mold damage. |
Key Takeaway
- Insufficient Force: Prioritizes short-term energy savings but sacrifices part quality and increases long-term mold maintenance.
- Excessive Force: Prioritizes part consistency but risks mold damage and wastes energy.
- Optimal Force: Strikes a balance—eliminates defects, minimizes wear, and ensures energy-efficient production.
Accurate clamping force calculation is critical to avoid these extremes and maintain a stable, cost-effective process.
4. Clamping Force Calculation Methods
Clamping force calculation in injection molding is critical to ensure mold integrity, part quality, and energy efficiency. Below is a detailed breakdown of two primary methods (theoretical and empirical), supported by formulas, examples, and advanced techniques from industry standards and research.
4.1 Method 1: Theoretical Calculation at the Mold Development Stage
This method relies on cavity pressure projections and material-specific coefficients.
4.1.1Formula:

- P: Cavity pressure (bar), derived from material properties and flow behavior.
- A: Projected area of the part + runners (cm²).
4.1.2 Step-by-Step Process:
1. Calculate Projected Area:
- For a rectangular part: A=Length×Width.
- For complex geometries, decompose the part into simple shapes (e.g., cylinders, rectangles) and sum their areas.
- Example: A part with 103×63mm dimensions has A=259.65 cm².
2. Determine Cavity Pressure:
- Use flow length-to-thickness ratio (L/t):
- Example: For a wall thickness of 0.8mm and flow length 60mm, L/t=75.
- Reference cavity pressure tables based on L/t and material:
| L/t | Material | Cavity Pressure (bar) |
| 75 | PC | 500 |
| 150 | ABS | 450 |
| 200 | PP | 350 |
3. Apply Formula:
- Example for PC:

4.1.3 Advantages & Limitations:
- √ Ideal for new mold designs.
- √ Minimizes trial-and-error costs.
- × Assumes uniform cavity pressure (ignores localized shear or gate effects).
4.2 Method 2: Production Test Method
This iterative approach adjusts clamping force during production to identify the optimal setting.
4.2.1 Process:
1. Initial Setup:
- Start with a clamping force slightly above the theoretical minimum (e.g., 130 tons for the PC example).
- Monitor part weight and flash formation using precision scales.
2. Adjustments:
- Reduce force incrementally (e.g., 5 tons5tons per cycle) until flash appears.
- Increase force by 10–15% above the flash threshold to ensure safety.
3. Validation:
- Optimal force is achieved when part weight stabilizes and flash is eliminated.
- Example: A test reducing force from 40tons to 30tons eliminated flash in ABS parts while maintaining dimensional accuracy.

4.2.2 Advantages & Limitations:
- √ Accounts for real-world variables (e.g., machine wear, material batch variations).
- √ Validates theoretical calculations.
- × Time-consuming and material-wasteful.
4.3 Advanced Techniques
4.3.1 Clamping Force Coefficients (Kp):
- Empirical constants simplify calculations:

- Material-Specific Kp Ranges:
| Material | Kp (tons/cm²) |
| PC | 0.62–0.77 |
| ABS | 0.45–0.60 |
| PP | 0.35–0.45 |
- Example for ABS:

4.3.2 Digital Twin Simulations:
- Mold flow analysis predicts pressure distribution and optimizes clamping force.
- Example: A simulation reduced clamping force by 20% for a thin-walled PE container while avoiding flash.
4.3.3 Tonnage Factor Method:
- Formula:

- Tonnage Factors:
| Material | Tonnage Factor (tons/in²) |
| GPPS | 2–3 |
| PA66 | 4–5 |
| PC | 5–6 |
- Example: For a 5×5 in PC part:

4.4 Critical Considerations
1. Safety Margins:
- Add 10–15% to theoretical values to account for pressure spikes or material variability.
2. Machine Compatibility:
- Ensure the machine’s maximum clamping force exceeds the calculated value (e.g., use a 150 ton machine for a 130 ton requirement).
3. Mold Temperature Effects:
- Lower mold temperatures increase viscosity, requiring higher clamping force.
- Example: Cooling ABS from 60∘C to 40∘C raised clamping force from 120 tons to 138 tons.
4.5 Comparison of Methods
| Method | When to Use | Accuracy | Time/Cost |
| Theoretical | New mold design, limited data | Moderate | Low |
| Production Testing | Existing molds, validation | High | High |
| Digital Twin | Complex geometries, R&D | Very High | Moderate |
4.6 Practical Example
Scenario: A 4-cavity mold for ABS parts with 200 cm² projected area.
1. Theoretical Calculation:
- Fclamp=0.45 tons/ cm²×200 cm²=90 tons.
2. Production Test:
- Initial force: 100 tons (10% safety margin).
- Reduced to 85 tons caused flash; optimal force set at 95 tons.
3. Result:
- Energy savings: 5%.
- Cycle time reduction: 8% due to lower hydraulic strain.
5. Using Clamping Force Coefficients
Clamping force coefficients (Kp) are empirical values derived from material behavior and industry experience to simplify clamping force calculations. They eliminate the need for complex cavity pressure simulations and provide a practical “rule of thumb” for engineers. Below is a detailed explanation of their application, limitations, and a consolidated datasheet for quick reference.
Kp (Clamping force coefficients) is a material- and geometry-dependent constant (units: tons/cm²) that relates the projected area of a part to the required clamping force. It encapsulates factors like:
- Material viscosity: Higher viscosity = higher Kp.
- Flow length-to-thickness ratio (L/t): Longer flow paths or thinner walls increase Kp.
- Mold design complexity: Multi-cavity molds or intricate runners may require adjustments to Kp.
5.1 Formula:
- A: Projected area of part + runners (cm²).
- Kp: Material-specific coefficient (see datasheet below).
5.2 How to Select Kp
1. Material Type:
- Each thermoplastic family has a characteristic Kp range (e.g., PC: 0.62–0.77 tons/cm²; PP: 0.35–0.45 tons/cm²).
- Semi-crystalline materials (e.g., PA66) often require higher Kp values than amorphous resins (e.g., ABS) due to rapid volumetric shrinkage.
2. Wall Thickness and L/t Ratio:
- Thin walls (<1.5 mm) or high L/t ratios (>150:1) push Kp toward the upper end of the range.
3. Gate Design:
- Smaller gates restrict flow, requiring a Kp increase of 10–15%.
Clamping Force Coefficients Datasheet
| Material | Viscosity (Pa·s) | Kp Range (tons/cm²) | Typical Kp | Applicable L/t Ratio |
| ABS | 200–300 | 0.30–0.48 | 0.38 | 50:1 – 150:1 |
| PC | 400–600 | 0.62–0.77 | 0.68 | 50:1 – 120:1 |
| PP | 100–200 | 0.35–0.45 | 0.40 | 100:1 – 200:1 |
| PE | 50–150 | 0.30–0.40 | 0.35 | 80:1 – 180:1 |
| PA66 | 300–500 | 0.50–0.65 | 0.58 | 60:1 – 130:1 |
| POM | 250–400 | 0.55–0.70 | 0.63 | 70:1 – 150:1 |
Notes:
1. Viscosity: Measured at typical processing temperatures (e.g., ABS at 230°C).
2. Typical Kp: Mid-range value for standard wall thickness (2–3 mm).
3. Adjustments:
- Thin walls: Add 15–20% to Kp.
- Multi-cavity molds: Multiply Kp by cavity count.
6. Machine Selection Based on Clamping Force
1. Machine Clamping Force Range:
Optimal clamping force should be 70%–85% of the machine’s maximum capacity. For a calculated 200-ton requirement, choose a machine with ≥235 tons maximum force (200 / 0.85 ≈ 235).
2. Mold-Machine Compatibility Checks:
- Platen Size: Mold dimensions must fit the machine’s maximum mold mounting area.
- Mold Opening Stroke: Must accommodate part ejection height.
- Ejection Force: Ensure the machine’s ejection system matches the part’s complexity (e.g., deep ribs or undercuts).
6.1 Example: Machine Models vs. Clamping Force (Datasheet Summary)
| Machine Model (Example) | Max Clamping Force (tons) | Suitable Product Types | Max Projected Area (cm², ABS Example) | Key Notes |
| Compact (50T) | 50 | Micro parts (buttons, connectors) | ≤100 cm² | Cavity pressure ≤500 kgf/cm² |
| Medium (200T) | 200 | Appliance housings, automotive trim | ≤400 cm² | Safety factor ≤1.3 |
| Large (500T) | 500 | Luggage cases, industrial pallets | ≤1000 cm² | For high-flow materials (e.g., PP, PE) |
| Heavy-Duty (2000T) | 2000 | Automotive bumpers, large containers | ≤4000 cm² | Requires cavity pressure ≥600 kgf/cm² for PC |
Notes:
- Projected Area Limits: Calculated inversely from S=F/(p×K). Example: For 200T, S=(200×1000)/(500×1.3)≈307cm². Practical limits include a 20–30% buffer.
- High-Viscosity Materials (e.g., PC, PMMA): Require 20–30% higher clamping force due to cavity pressures of 600–800 kgf/cm².
6.2 Common Mistakes & Optimization Tips
1. Mistakes:
- Overestimating Force: Using a 500T machine for a 200T part increases energy consumption by 30% and risks mold deformation.
- Ignoring Runner Systems: Multi-cavity molds must include runner area in projected area calculations.
2. Optimization:
- Dynamic Testing: Gradually reduce clamping force until flash occurs, then set force 10% above this threshold (e.g., 90 tons for an 80-ton flash limit).
- Real-Time Monitoring: Use strain gauges or ultrasonic sensors on tie bars to ensure uniform force distribution.
- Hydraulic System Checks: Leakage can reduce actual clamping force by 10–15%; calibrate every 3 months.
7. Practical Tips for Optimizing Clamping Force
- Balance Clamping and Injection Pressure:
Always adjust the clamping force in relation to the injection pressure. Using excessive clamping force can damage the mold and increase machine wear, while insufficient force may lead to flash or parting line separation. Aim for the minimum force necessary to keep the mold securely closed without defects. - Regular Calibration and Testing:
Periodically calibrate your injection molding machines to ensure accurate force application. During production, conduct tests to verify the optimal clamping force. Fine-tune the settings based on part quality and stability to prevent inconsistencies. - Leverage Mold Flow Analysis:
Use CAE software to simulate the clamping force required for specific parts. This helps identify potential force inconsistencies and optimizes the mold design before production, reducing trial-and-error adjustments. - Optimize Mold Design:
Improve mold efficiency by enhancing its design. Adding venting channels reduces internal pressure buildup, while balanced multi-cavity molds help distribute force evenly. Proper mold design minimizes unnecessary force requirements and enhances part quality. - Monitor Machine Performance:
Regularly track machine parameters, such as platen parallelism and hydraulic system efficiency. Deviations in these factors can affect the required clamping force. Adjust the settings accordingly to maintain consistent performance. - Document Optimal Clamping Force:
Clearly record the ideal clamping force in mold manuals and machine settings. This ensures consistent production quality and provides a reliable reference for machine operators, reducing errors caused by guesswork or inconsistencies.
8. Common Mistakes and Tips
| Mistake | Issue | Tip |
| Overestimation of clamping force | – Mold deformation and reduced service life – Increased machine wear and energy consumption – Parting line damage |
Accurately calculate force and fine-tune through production tests |
| Underestimation of clamping force | – Mold separation during injection – Flash formation and dimensional inaccuracies – Inconsistent part quality |
Use correct cavity pressure and projected area in force calculations |
| Neglecting material viscosity and flow properties | – Inaccurate force estimations due to material variations – Potential part defects |
Include material group coefficient (Kp) or viscosity constant in calculations |
| Omitting force values from mold manuals | – Inconsistent production quality across batches – Guesswork in force settings |
Clearly mark optimal clamping force (in tons) in mold documentation |
| Inconsistent mold maintenance | – Mold wear affects sealing force – Variations in required clamping force over time |
Perform regular mold cleaning and re-calculate force as needed |
| Relying solely on theoretical calculations | – Real-world factors cause inaccuracies – Suboptimal molding conditions |
Conduct production tests to fine-tune clamping force for accuracy |
Conclusion
Accurate clamping force calculation is essential for maintaining product quality and extending mold longevity in injection molding. Applying the correct force prevents defects such as flash, warping, and short shots, while also protecting the mold from unnecessary stress and premature wear. By considering factors like cavity pressure, projected area, and material properties, manufacturers can achieve consistent, high-quality production.
As the leading on demand manufacturer, KingStar Mold we understands the critical role that precise clamping force plays in delivering flawless molded parts. Our expert team leverages advanced mold flow analysis, precise testing, and state-of-the-art injection molding technology to ensure every project meets the highest quality standards. We work closely with our clients, offering tailored solutions that optimize clamping force, reduce cycle times, and extend mold life.
Whether you require small-batch production or high-volume manufacturing, KingStar Mold is committed to delivering reliable, defect-free parts with superior consistency. Partner with us to benefit from our industry expertise, cutting-edge technology, and dedication to quality in every molded product.
